When a crash is caused by heap corruption, the crash stack trace is often from a thread that fell victim to heap corruption caused by other code. This can easily lead to false assumptions and wasted time diagnosing the crashing thread's call stack.
If heap corruption is suspected, a technique known as Full Page Heap checking can be used to locate the culprit. Enabling Full Page Heap should be avoided on most production machines due to extreme memory and CPU overhead. If possible, reproduce the issue in a test environment and debug there.
Use the steps below to enable Full Page Heap checking and find the offending code.
Download WinDBg standalone (still through SDK) from https://docs.microsoft.com/en-us/windows-hardware/drivers/debugger/debugger-download-tools
Only tick the component, "Debugging Tools for Windows"

By default, it is installed into the folder, C:\Program Files (x86)\Windows Kits\10\Debuggers\x64
Now, the tool has been installed, we need to turn on heap checking on the application that we want to debug.
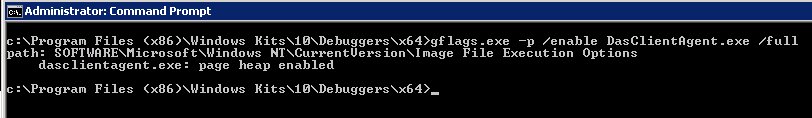
Open a command window (cmd.exe) as admin and change directory to the Windbg installation directory.
Run the command below:
gflags /p /enable <executable.exe> /full
(replace <executable.exe> with the name of the application to debug , e.g. DasClientAgent.exe
Restart the service, e.g. DasClientAgent
net stop DasClientAgent
net start DasClientAgent
Next, we need to enable crash dump on the application that we want to debug.
First, create a folder for saving dump files, for instance: c:\dumps
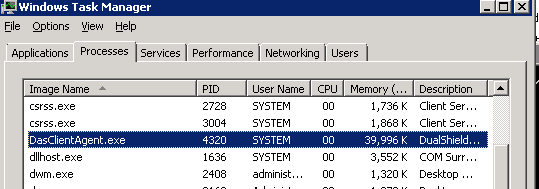
There are 2 options to enable crash dump on the application, using the PID of the application or the Image Name of the application.
We can find the PID and Image Name of an application from the Task Manager:
Use the command below to enable crash dump with Image Name:
adplus -crash -pn <image name> -o c:\dumps
(Replace <image name> with the image name of the application found in the task manager, e.g. DasClientAgent.exe)
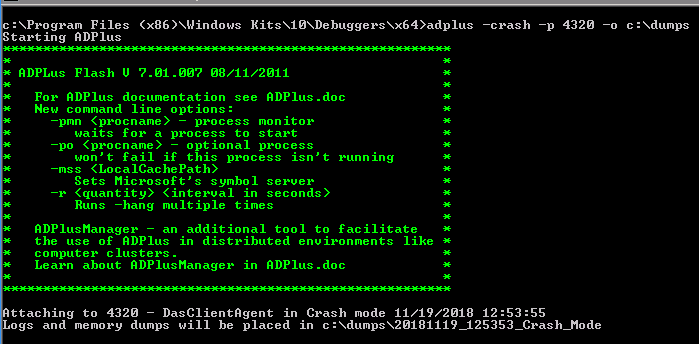
Use the command below to enable crash dump with PID:
adplus -crash -p <pid> -o c:\dumps
(Replace <pid> with the PID of the applicaiton found in the task manager, e.g. 4320)
Please note that, if the PID changes, for instance, due to machine reboot, then you will have to re-enable crash dump with the new PID.
Finally, we wait for the crash to happen.
After the crash has happened, disable crash dump,
gflags.exe -p /disable DasClientAgent.exe
And restart the service, e.g. DasClientAgent
net stop DasClientAgent
net start DasClientAgent
References
Finding process Heap Corruption using Windbg
SAVE OUR SOULS -TROUBLESHOOTING HEAP CORRUPTION THE CLASSIC WAY WITH GFLAGS AND WINDOWS DEBUGGER