
Applies to: DualShield v9+ on JDK 25, installed as a Windows service via procrun
Time required: about 10 minutes, plus one service restart
Why
When a DualShield server saturates the CPU, the system becomes unresponsive and the administrator almost always restarts the service or reboots the machine before any diagnostic is collected. The recovery action destroys the evidence, and the case cannot be progressed.
The settings below make the JVM record what it is doing continuously to disk. The data is already written before anyone reaches for the restart button, so a restart or even a power cut no longer loses it. After the incident, support asks for one thing — the logs folder — and gets a time-series of stack samples naming the exact method that burned the CPU.
Apply this before an incident. It is preventative, not a response step.
What gets enabled
Setting | What it gives you |
|---|---|
Java Flight Recorder (JFR) | Rolling 24h of execution samples, GC, locks, I/O and exceptions. Identifies the hot code path. |
GC logging | Distinguishes a garbage-collection death spiral from a genuine hot loop, usually within seconds of reading. |
Heap dump on OOM | Captures the heap automatically the moment an OutOfMemoryError is thrown. |
Before anything: confirm the bundled runtime supports JFR
DualShield ships a JRE, not a JDK, at C:\Program Files\Deepnet DualShield\jre. It has no jcmd, jmap, jstack or jhsdb. If that runtime was also trimmed of the jdk.jfr module then flight recording is unavailable and this page does not apply as written.
Check first:
"C:\Program Files\Deepnet DualShield\jre\bin\java" --list-modules | findstr jfr |
"C:\Program Files\Deepnet DualShield\jre\bin\java" --list-modules | findstr jfr
Prerequisites
Step 1 — create the JFR repository directory
Everything below writes into Tomcat's existing log directory, C:\Program Files\Deepnet DualShield\tomcat\logs, which DAS already writes to and the service account can already write to. Only the JFR repository subdirectory needs creating:
mkdir "C:\Program Files\Deepnet DualShield\tomcat\logs\jfr" |
mkdir "C:\Program Files\Deepnet DualShield\tomcat\logs\jfr"
The rolling JFR chunk files are kept in that subdirectory to avoid burying the Tomcat and DAS logs in them. The GC log and the shutdown recording are written to the log directory itself.
Step 2 — validate the options before touching the service
Do this first. A malformed option makes the JVM refuse to start, and diagnosing that through a Windows service is far more painful than through a command prompt.
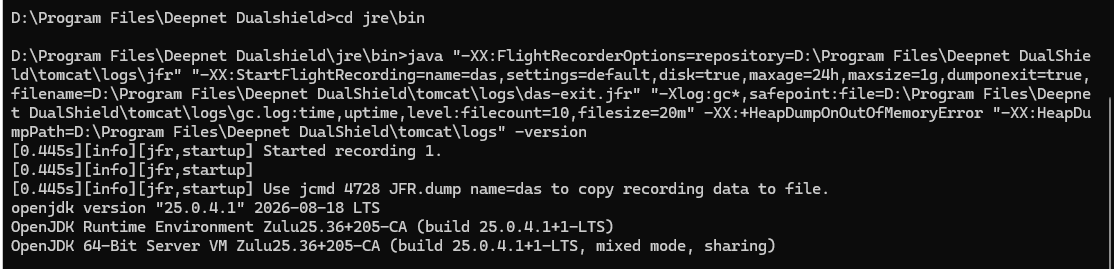
From a command prompt, using the same JDK the service runs (jre\bin under the install directory). Every option containing a space must be quoted here, and the quotes go around the whole option, not just the path:
java "-XX:FlightRecorderOptions=repository=C:\Program Files\Deepnet DualShield\tomcat\logs\jfr" "-XX:StartFlightRecording=name=das,settings=default,disk=true,maxage=24h,maxsize=1g,dumponexit=true,filename=C:\Program Files\Deepnet DualShield\tomcat\logs\das-exit.jfr" "-Xlog:gc*,safepoint:file=C:\Program Files\Deepnet DualShield\tomcat\logs\gc.log:time,uptime,level:filecount=10,filesize=20m" -XX:+HeapDumpOnOutOfMemoryError "-XX:HeapDumpPath=C:\Program Files\Deepnet DualShield\tomcat\logs" -version |
expected the version banner prints, along with a line reporting that recording DualShield started.
Common failures at this step:
These quotes are needed only for this command-line check and for any .bat or setenv script. Do not carry them into Step 3 — procrun stores each option on its own line and quoting them there would make the quote part of the value.
Step 3 — add the options to the service
Preferred — the procrun GUI:
1. Run DualShieldw.exe //ES//<service-name> from the DualShield bin directory.
2. Open the Java tab.
3. Append each option below to Java Options, one per line. Do not disturb the existing lines.
Alternative — the registry. DualShield's JVM arguments live in the 32-bit registry view, not the native key:
HKLM\SOFTWARE\Wow6432Node\Apache Software Foundation\Procrun 2.0\<service-name>\Parameters\Java
Edit the Options value (type REG_MULTI_SZ, one option per line). On newer procrun builds running under JDK 9+, an Options9 value may be present and take precedence — if both exist, add the lines to whichever one is already populated with the current settings.
The options to add:
-XX:FlightRecorderOptions=repository=C:\Program Files\Deepnet DualShield\tomcat\logs\jfr -XX:StartFlightRecording=name=das,settings=default,disk=true,maxage=24h,maxsize=1g,dumponexit=true,filename=C:\Program Files\Deepnet DualShield\tomcat\logs\das-exit.jfr -Xlog:gc*,safepoint:file=C:\Program Files\Deepnet DualShield\tomcat\logs\gc.log:time,uptime,level:filecount=10,filesize=20m -XX:+HeapDumpOnOutOfMemoryError -XX:HeapDumpPath=C:\Program Files\Deepnet DualShield\tomcat\logs |
-XX:FlightRecorderOptions=repository=C:\Program Files\Deepnet DualShield\tomcat\logs\jfr -XX:StartFlightRecording=name=das,settings=default,disk=true,maxage=24h,maxsize=1g,dumponexit=true,filename=C:\Program Files\Deepnet DualShield\tomca
Add these unquoted, exactly as shown. Procrun stores each option as its own line and passes it to the JVM whole, so the spaces in the install path need no quoting — and adding quotes here would make them part of the path. Quoting is only needed on a command line or in a .bat or setenv script, as in Step 2.
Step 4 — restart the DualShield service
net stop DualShield net start DualShield
Use the actual service name for the installation.
Step 5 — verify it is running
There is no jcmd in the bundled JRE, so verification is by observation:
1. tomcat\logs\gc.log exists and is growing.
2. tomcat\logs\jfr\ contains one or more .jfr chunk files within a minute or two of startup.
3. The JFR startup message appears in the service's stdout log — normally tomcat\logs\commons-daemon*.log or tomcat\logs\stdout*.log, depending on how procrun is configured. A failure to start the recording is reported in the same place.
If tomcat\logs\jfr\ stays empty, check that the directory from Step 1 was created and that the service account can write to it. If the service now fails to start at all, an option is malformed — revert Step 3 and repeat Step 2.
Results:
Here is a plain-English breakdown of the results you will see once continuous JVM diagnostics are running on your DualShield server:
A continuous record of what the server was doing right up until a crash or freeze. Instead of losing all clues when a high-CPU incident forces a restart, the Java Flight Recorder (JFR) keeps a rolling 24-hour history of execution samples, memory garbage collection, locks, and I/O saved directly to your hard drive.
Exact identification of the code causing high CPU. By opening the recording files (jfr) in JDK Mission Control, you can drill down into the method profiling to pinpoint the exact internal method or loop that was burning up your CPU resources during an incident.
Immediate separation of memory issues from performance bottlenecks. The separate garbage collection log (gc.log) lets you look at trends within seconds to easily distinguish whether a slowdown is a genuine hot loop or a garbage-collection death spiral.
Automatic snapshots if the server runs out of memory. If the service ever throws an OutOfMemoryError, the JVM will automatically capture and dump the entire live heap to disk the exact moment it happens, letting you inspect what filled up the memory.
Easy retrieval through the console. Because the key summary and exit files are written straight into the main Tomcat log directory, you can download them directly through the DualShield Administration Console (DAC) system log list without needing RDP or file share access.